pd.read_csv(filename)# From a CSV filepd.read_table(filename)# From a delimited text file (like TSV)pd.read_excel(filename)# From an Excel filepd.read_sql(query,connection_object)# Reads from a SQL table/databasepd.read_json(json_string)# Reads from a JSON formatted string, URL or filepd.read_html(url)# Parses an html URL, string or file and extract tables to a list of dataframespd.read_clipboard()# Takes the contents of your clipboard and passes it to read_table()pd.DataFrame(dict)# From a dict, keys for columns names, values for data as lists
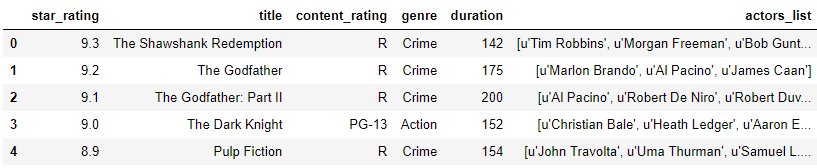
dataURL='https://raw.githubusercontent.com/justmarkham/pandas-videos/master/data/imdb_1000.csv'df=pd.read_csv(dataURL)df.head()# Prints first 5 rows of the DataFrame
df.index# Index Descriptiondf.columns# Columns in the DataFramedf.shape# Prints number of row and columns in DataFramedf.head(n)# Prints first n rows of the DataFramedf.tail(n)# Prints last n rows of the DataFramedf.info()# Index, DataType and Memory informationdf.describe()# Summary statistics for numerical columnss.value_counts(dropna=False)# Views unique values and countsdf.apply(pd.Series.value_counts)# Unique value and counts for all columnsdf.mean()# Returns the mean of all columnsdf.corr()# Returns the correlation between columns in a DataFramedf.count()# Returns the number of non-null values in each DataFrame columndf.max()# Returns the highest value in each columndf.min()# Returns the lowest value in each columndf.median()# Returns the median of each columndf.std()# Returns the standard deviation of each columndf.idxmax()# Index of the lowest valuedf.idxmin()# Index of the highest value
举个例子,在导入 IMDB 高分电影数据后统计一下每种电影类型的频数,我们就可以用:
1
df['genre'].value_counts()
选择
通常,我们可能需要选择单个元素或者数据的某个子集来进行深入分析。那么,这些方法就会大显身手:
1
2
3
4
5
6
7
8
df[col]# Returns column with label col as Seriesdf[[col1,col2]]# Returns columns as a new DataFrames.iloc[0]# Selection by position (selects first element)s.loc[0]# Selection by index (selects element as index 0)df.iloc[0,:]# First rowdf.iloc[0,0]# First element of first columndf.iat[0,0]# First element of first column. Access a single value for row/column pair by integer positiondf.at[row_label,col_label]# Access a single value for row/column label pair
df.columns=['a','b','c']# Renames columnspd.isnull()# Checks for null values, return Boolean Arraypd.notnull()# Opposite of pd.isnull()df.dropna()# Drops all rows that contain null valuesdf.dropna(axis=1)# Drops all columns that contain null valuesdf.dropna(axis=1,thresh=n)# Drops all rows hava less than non null valuesdf.fillna(x)# Replaces all null values with xs.fillna(s.mean())# Replaces all null values with the means.astype(float)# Converts the datatype of the series to floats.replace(1,'one')# Replaces all values equal to 1 with 'one's.replace([1,3],['one','three'])# Replace all 1 with 'one' and 3 with 'three'df.rename(columns=lambdax:x+1)# Mass renaming of columnsdf.rename(columns={'old_name':'new_name'})# Selective renamingdf.set_index('column_one')# Changes the indexdf.rename(index=lambdax:x+1)# Mass renaming of indexdf.drop(labels)# Drop specified labels from rows or columnsdf.drop_duplicates(subset)# Return DataFrame with duplicate rows removed, optionally only considering certain columns
df[df[col]>0.5]# Rows where the col column is greater than 0.5df[(df[col]>0.5)&(df[col]<0.7)]# Rows where 0.5 < col < 0.7df.sort_values(col1)# Sorts values by col1 in ascending orderdf.sort_values(col2,ascending=False)# Sorts values by col2 in descending orderdf.sort_values([col1,col2],ascending=[True,False])# Sorts values by col1 in ascending order then col2 in descending orderdf.groupby(col)# Returns a groupby object for values from one columndf.groupby([col1,col2])# Returns a groupby object values from multiple columnsdf.groupby(col1)[col2].mean()# Returns the mean of the values in col2, grouped by the values in col1 (mean can be replaced with almost any function from the statistics section)df.pivot_table(index=col1,values=col2,col3],aggfunc=mean)# Creates a pivot table that groups by col1 and calculates the mean of col2 and col3df.groupby(col1).agg(np.mean)# Finds the average across all columns for every unique column 1 groupdf.apply(np.mean)# Applies a function across each columndf.apply(np.max,axis=1)# Applies a function across each row
df.to_csv(filename)# Writes to a CSV filedf.to_excel(filename)# Writes to an Excel filedf.to_sql(table_name,connectiion_object)# Writes to a SQL tabledf.to_json(filename)# Writes to a file in JSON formatdf.to_html(filename)# Saves as an HTML tabledf.to_clipboard()# Writes to the clipboard
pd.concat([df1,df2],axis=1)# Adds the columns in df1 to the end of df2pd.merge(df11,df2)# SQL-style mergesdf1.append(df2)# Adds the rows in df1 to the end of df2 (columns should be identical)df1.join(df2,on=col1,how='inner')# SQL-style joins
pd.DataFrame(np.random.rand(20,5))# 5 columns and 20 rows of random floatspd.Series(my_list)# Create a series from an iterable my_listdf.index=pd.data_range('1900/1/30',periods=df.shape[0])# Add a date index
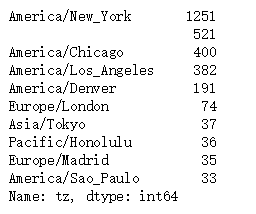
bitly_usagov 数据集分析
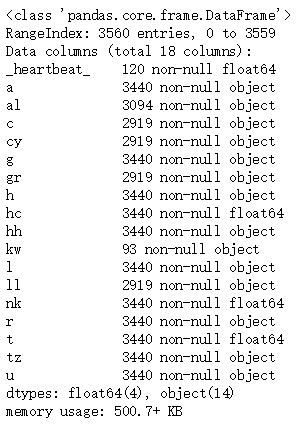
或许我们可以从一个实例(来源于书籍《Python for Data Analysis》)出发,当作一个小练习。选用的是bitly_usagov数据集。
该数据集可以在:https://github.com/wesm/pydata-book 处找到。
导入数据
假如将数据下载到了本地,我们可以尝试将其导入并得到 DataFrame 对象,便于之后的分析工作。
1
2
3
4
5
importpandasaspdfile_path='../../Datasets/bitly_usagov/example.txt'# Local file pathdf=pd.read_json(file_path,lines=True)df.info()


 支付宝
支付宝
 微信
微信